Summary
Summary Narrative of the Analysis
Contents
- Intro/Background about World Cup
- Motivation for predicting the World Cup
- Description of Initial Data (including cleansing procedures)
- Baseline models (created with the above datasets)
- Interesting Investigations/Additional features + EDA
- Improved Models
- Best Model
- Final Analysis, Conclusion, and Future Directions
- Results (for reference)
Description of Initial Data (including cleansing procedures)
The first provided dataset consisted of player statistics from 17994 current professional soccer players, representing 190 countries. It included numerical variables such as overall score and potential, but also categorical variables such as league, and nationality. The second provided dataset consisted of head-to-head matchups between national countries that gave the venue location, the name of the home and away team, and the number of goals for each team.The third dataset was a FIFA ranking dataset that ranks all of the national soccer teams by points. To clean them, and use them as feature sets, we just averaged the player statistics by country, and plugged them into the head-to-head dataset.
Baseline models (created with the above datasets)
We constructed two baseline models that incorporated features from the aforementioned given datasets. We constructed the feature set for these baseline models by aggregating the player statistics for each country, and then replacing these country statistics for the country name in the head-to-head dataset. We then performed an 80-20 train-test-split, to train both models. The first model was a W/L/D classification model achieved a meager 48% test set classification accuracy. We used logistic regression as a classification model architecture and used the gridsearchCV method provided by sklearn to tune the hyperparameters. The response variable in this model’s case was whether the home team won, drew, or lost to the away team. The second baseline model was a Goal Differential regression model which achieved a similarly poor r^2 score of 0.04. We used linear regression as a regression model architecture and again used gridsearchCV to tune the hyperparameters. The response variable was the score difference between the home and away team. We didn’t use the expected points baseline model, because we felt that one classification and one regression model would be enough to differentiate between.
Interesting Investigations/Additional features + EDA
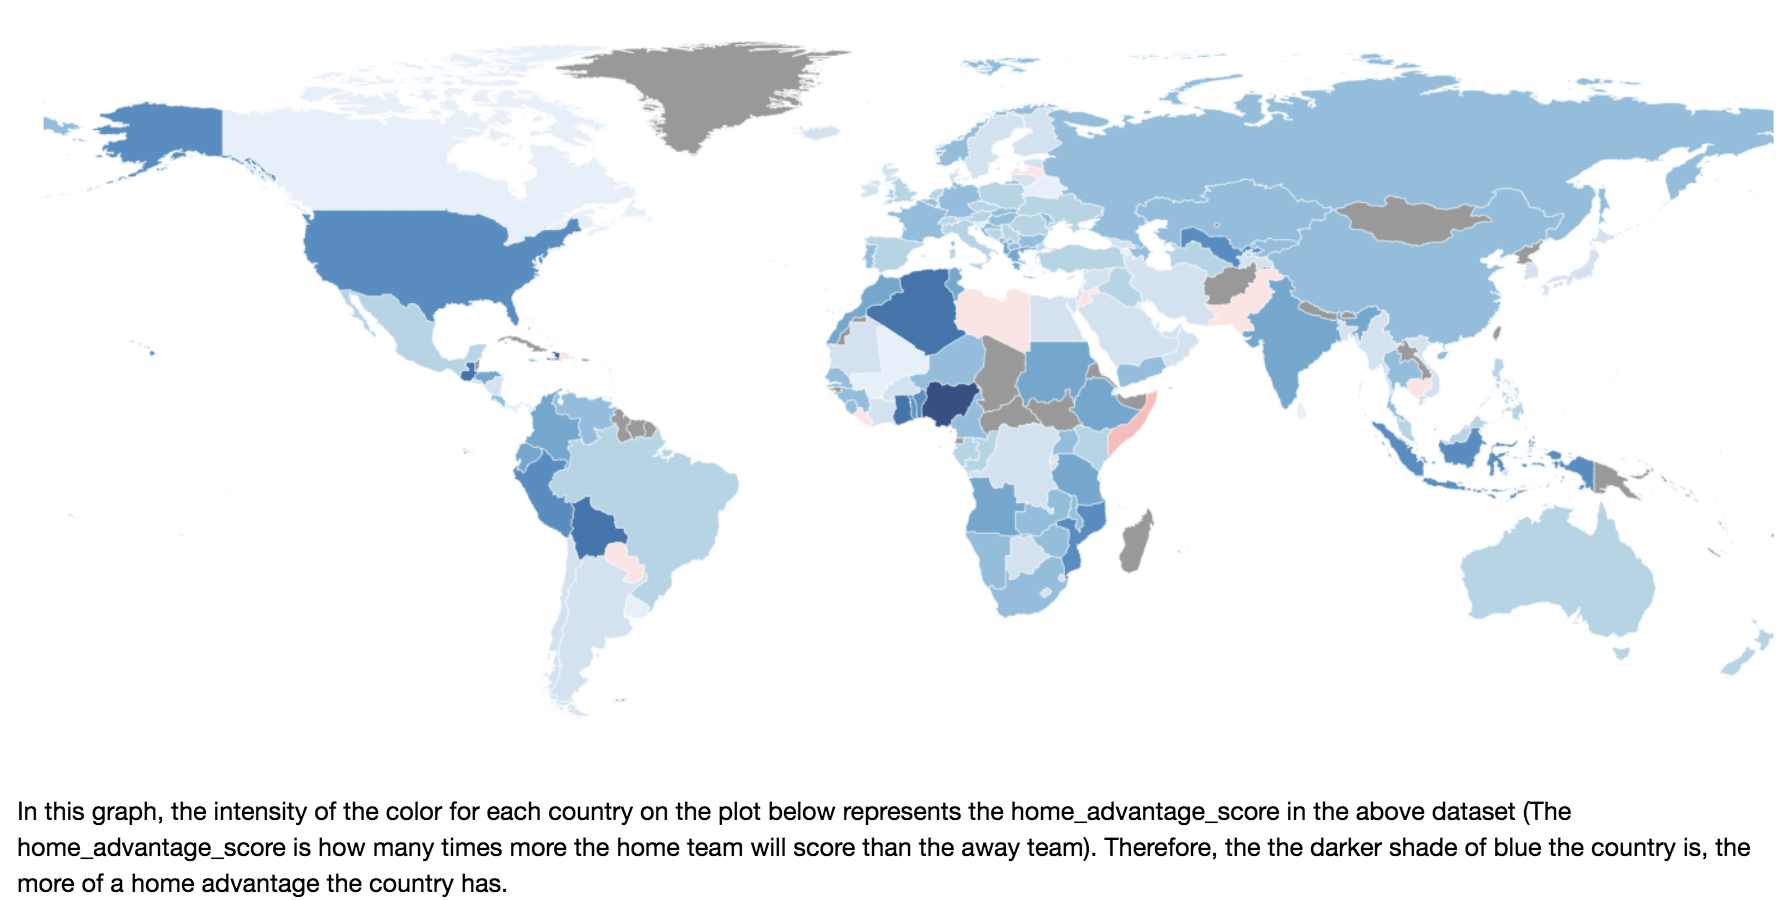
With the bare-bones models completed, we began to scrape and analyze new feature to enrich the feature set. First, we explored the truth of the home-country advantage, finding that it was extremely prevalent, especially in areas with low official regulation. In addition, generalized the home-country advantage by confederation, and found South America and Africa to have the biggest home-country advantages. We were able to model these and neutral-site advantages, by using a Poisson helper model, which modeled the distribution in home and away team goals in different countries.

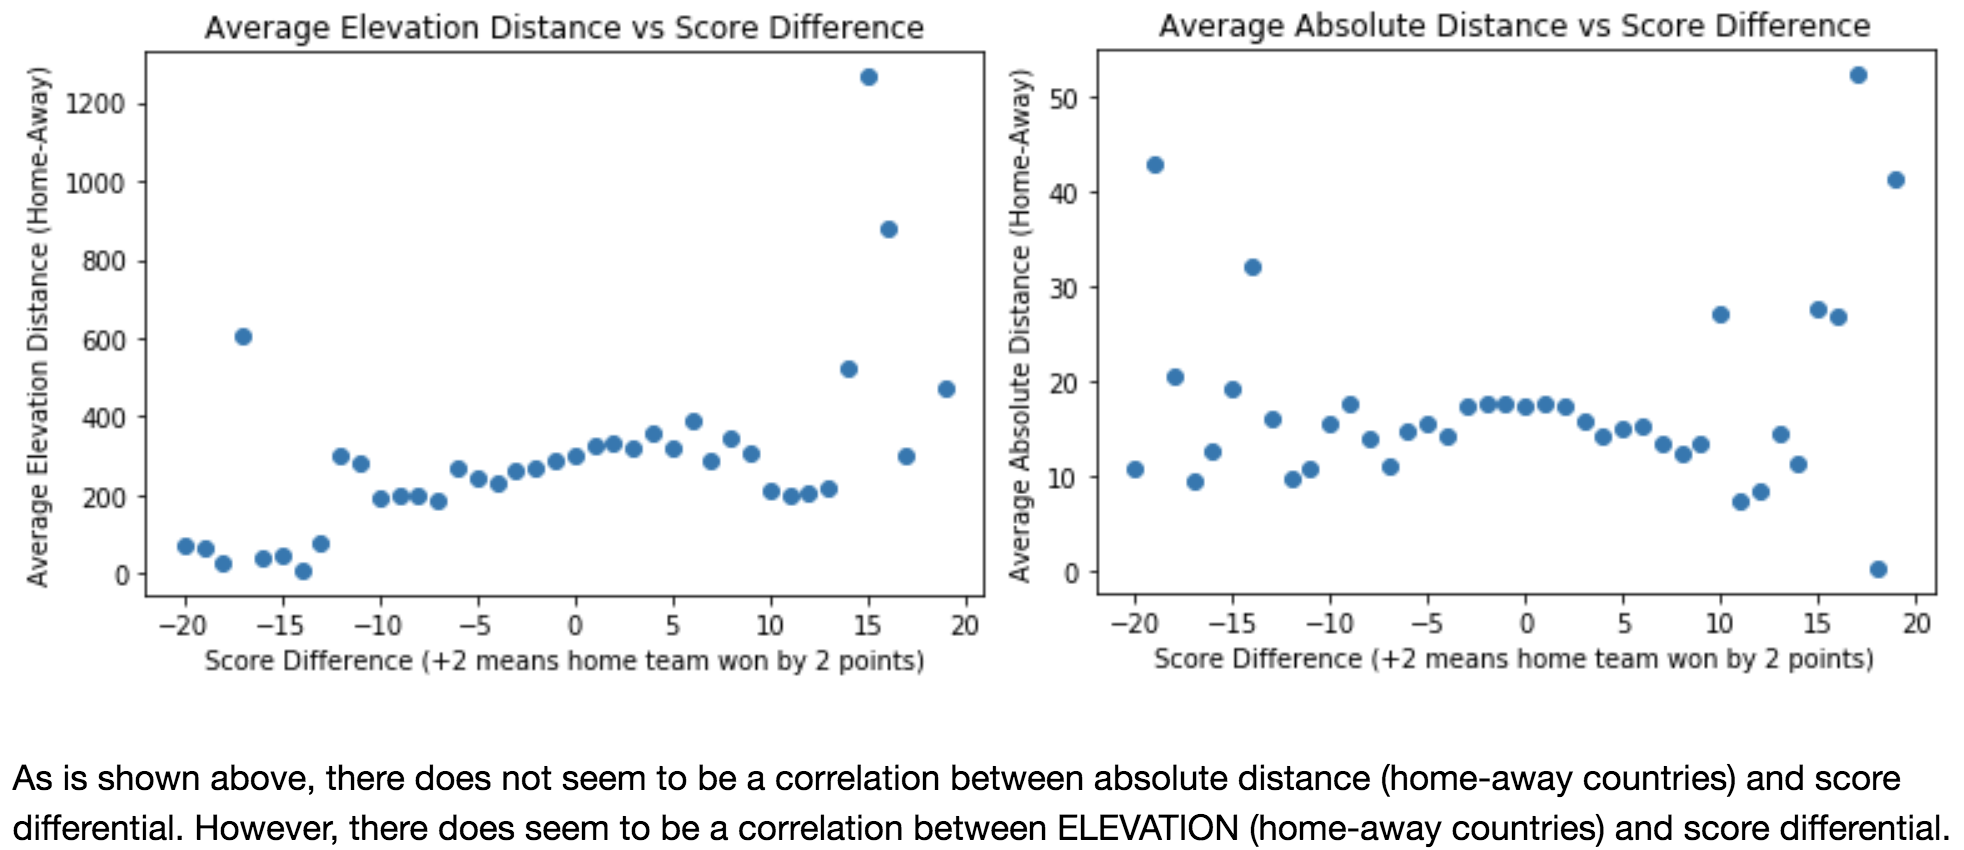
We then scraped game-day statistics such as elevation, longitude, and latitude of the stadium that the match was being held at. After our EDA, we found that elevation played the most important role in the outcome of the match, and seems to have a somewhat linear correlation.

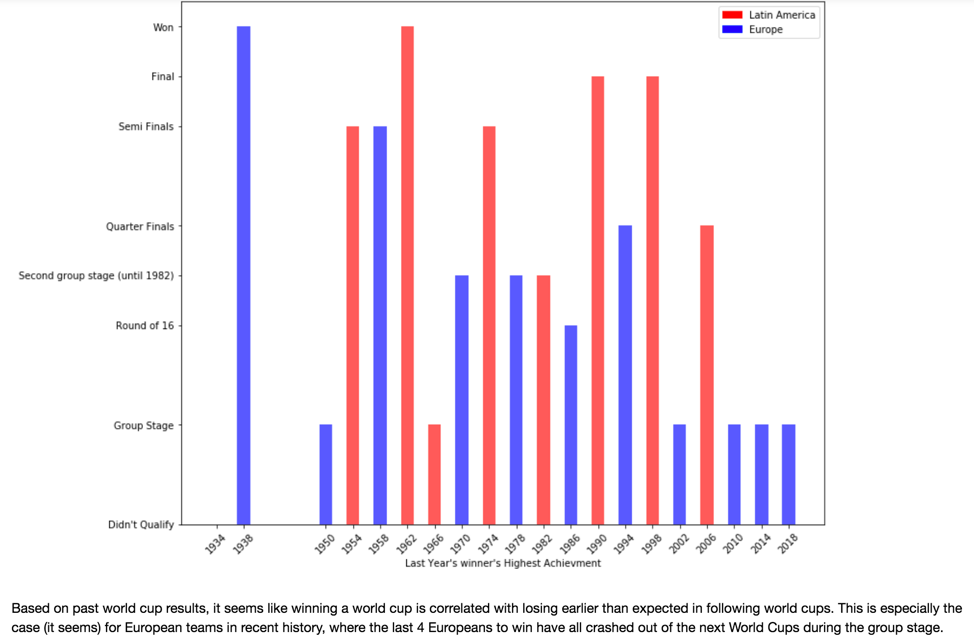
Next, we examined the so-called “Champion’s Curse”, which we found to be a very important factor. Only 2 of the 21 previous winners of the World Cup have won the world cup twice consecutively, while the rest have done relatively poorly, showing that there is a clear Winner’s Disadvantage.

Next, we examined the so-called “Champion’s Curse”, which we found to be a very important factor. Only 2 of the 21 previous winners of the World Cup have won the world cup twice consecutively, while the rest have done relatively poorly, showing that there is a clear Winner’s Disadvantage.

Improved Models
We proceeded to improve upon our baseline models by re-running our baseline models with this expanded feature set: Our classification model achieved a test classification accuracy of 55%, while the regression model achieved an r^2 score of 0.19. We improved 7% in the classification model test set classification accuracy and 0.15 in the regression model r^2 score. We determined that the all of the predictors were important in both of the models through stepwise visualizations.
Best Model
While these improvements were major, we still feel that the results didn’t improve upon the predictive power of the models found in the literature, so there was still another step to go. In this final model, we aimed to find the best model architecture and hyperparameters to optimize performance on the expanded feature set. After consulting the literature and then performing lots and lot of cross-validation, we found that a Random Forest Model with a length of 5 performed the best, achieving a test classification accuracy of 61.5% for the classification model. In this final model, we were able to exclude FIFA ratings as a predictor, making it even more robust on the World Cup 2018 dataset (which we used as a test set), where it predicted the outcomes of 40 out of the 64 matches correctly!
Final Analysis, Conclusion, and Future Directions
In this project, we were able to create a final prediction model with State-of-the art predictive power, by building off of previous work that had been done in the field, as well as creating a large feature set of relevant and significant features, and utilizing the optimal architecture and hyperparameters (Random Forest classifier with a depth of 5). Impressively, the model was able to predict the outcome (win/loss/draw) of 40 out of the 64 total World Cup Matches in 2018, using the 32-feature expanded feature set we created! Interestingly, we found that this classification method was more accurate than the goal difference method, while training on the same data. This is most likely because the goal difference model almost never predicted exactly 0, so the number of draws was dramatically reduced. We were able to fix this (to some extent) by increasing the range of draw values, but still preferred the classification model because of its simplicity in interpretation.
As always, the future extension of work is to find and model even more externalities that affect the outcomes of these world cup matches. This goes hand-in-hand with gaining more domain knowledge and including more relevant predictors. Thus, the future work will mainly be diving deeper into two areas: relevant feature-set expansion, and model selection. In retrospect, this was a fantastic introduction to a real-life application to data science.
Results (for reference)
Goal Difference (Baseline Model)
Training r^2 score: 0.09
Test r^2 score: 0.04
Win/Loss/Draw (Baseline Model)
Training Classification Accuracy: 51%
Test Classification Accuracy: 48%
Goal Difference (Improved Model)
Training r^2 score: 0.32
Test r^2 score: 0.019
Win/Loss/Draw (Improved Model)
Training Classification Accuracy: 57%
Test Classification Accuracy: 55%
Win/Loss/Draw (Best Model)
Training Classification Accuracy: 66%
Test (World Cup 2018 dataset) Classification Accuracy: 61.5%